
You should look at these numbers in Squarespace Analytics

In Squarespace's analytics tool, you can find useful statistics on how people use your website. Here we give you our tips on which numbers to keep an eye on.
Built into Squarespace is a tool called "Analytics". Here you can find useful information about how people use your website and whether it actually works the way you want it to.
Why bother with analytics?
Think of it this way: Would you set up a shop in the local pedestrian street, but never check how many customers are stopping by, if the customers are satisfied or if they actually buy anything?
We didn't think so, no.
It's the same with websites. To find out what works and what doesn't, you simply have to look at how the website performs, find areas for improvement, test and adjust. And to do that, we need analysis tools such as Squarespace Analytics.
Main categories in Squarespace Analytics
Overall, the Analytics tool is divided into four main areas:
Overview: Gives you, among other things, an overview of sales from the website, visits to the website and geography of the visitors.
Commerce: Tools for online stores that sell products online. Here you will find an overview of sales and purchase funnels.
Aquisition: Here you can find out where the traffic to your website is coming from, and see what keywords people have used to find you in the search engines.
Engagement: Lets you see, among other things, which subpages are most visited, buttons clicked and forms submitted - and more.
We think you should keep an eye on these numbers:
1. Visits: How many visits do you get?
The most basic first: Under "Traffic" you will find statistics on the number of visits to your website.
Here you can see the total number of visits, how many of these visits were from unique visitors and how many pageviews you have received in total. By clicking on the various tabs at the top of the page (see screenshot below), you can also get a graph that visualizes the numbers.
Remember that you can customize the time period you're looking at by clicking on the drop-down menu in the top right corner (see the screenshot below, where it says "Last 30 days").
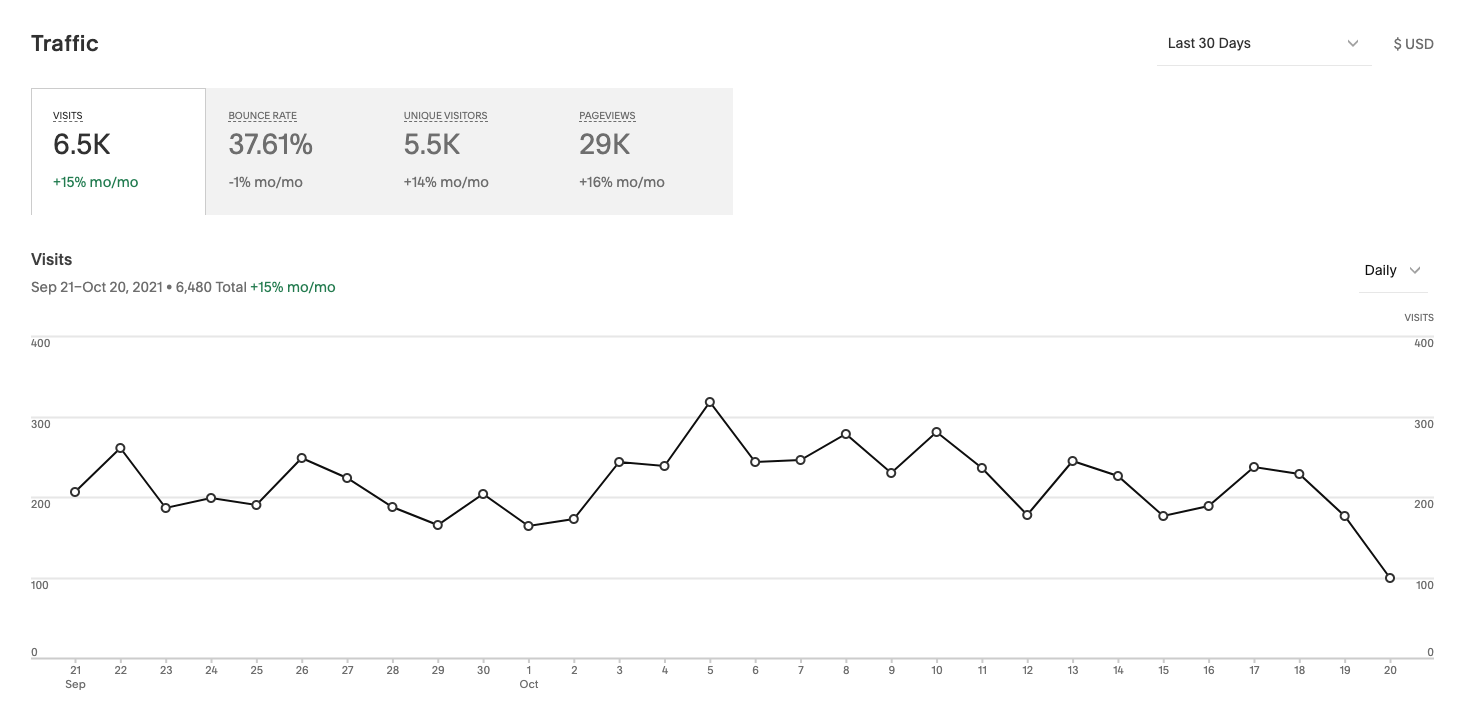
Under "Traffic" you can see the number of visits to the website, the number of unique visitors and pageviews.
2. Bounce rate: Are visitors active on the website?
"Bounce rate" can be translated as "fluktfrekvens" in Norwegian. This is a figure that shows the percentage of visitors who leave your website without interacting (clicking, scrolling etc.). In other words, they "bounce".
There is no set formula for what constitutes a good or bad bounce rate, as it will vary from website to website. But as a rule of thumb, we can say that anything between 26 and 70 percent is within the norm.
If the escape rate is high, it may indicate that visitors can't find what they're looking for, that they've encountered a technical problem or that they've simply come to the wrong place. Either way, you should keep an eye on this number. If it gets too high, you may need to consider making some changes to your website.

The "Bounce rate" tab gives you an overview of the bounce rate on the website.
3. Top Devices: Do they use mobile, PC or tablet?

"Top Devices" shows you whether the website is most visited from mobile, PC (desktop) or tablet. Here we see a slight predominance of users from mobile.
We always have our mobile phones in our pockets, so you'd almost think that most websites get the most visits from them. But in our experience, it depends on the type of industry you're in, where your customers are physically when they visit the website and what mode they're in when they do so.
If you sell accounting software, for example, it's likely that most customers will visit your website when they're at work. They are also more likely to be sitting at a PC screen than on their mobile.
Another example of why "Top Devices" is interesting: If the majority of people visit your website on mobile, it's extra important that it looks good and works well in mobile viewing. It's also a good idea to keep this in mind when working with texts and content on the website. For example, long, coherent paragraphs of text will not look as good on a small mobile screen.
4. Geography: Kor befinn dei seg?
This is probably particularly relevant if you operate across national borders, but can also be interesting for those who only have customers in Norway. Under "Geography" you can see both country, region and city/area. This can be useful to see where you are most "popular" today, and whether you are meeting the right people.
For example, if you only have a business in Fredrikstad, it's not so good if all your traffic comes from Bergen. You may need to make it even clearer where you are and find new ways to reach people in the area.
5. Traffic Sources: Where does the traffic come from?
One of the most interesting things is to see where people come from when they find their way to your website. Did they search on Google, click on a Facebook post or type your URL directly into their browser?
Traffic Sources tells us about the source of the traffic, i.e. which channel the visitor came from. By looking at these figures, you can find out whether the marketing you do in the various channels actually generates traffic to the website - and where you might need to put in extra effort.
Direct: Direct traffic to the website. For example, enter the URL or have it saved as a bookmark.
Social: Have clicked on a link in social media such as Facebook, LinkedIn and Instagram.
Search: Have searched on Google or another search engine.
Email: Have clicked on a link in an email or newsletter.
Referral: Clicked on a link on another website, such as partners, online newspapers, etc.

Under "Traffic Sources" you can see which channels generate traffic to your website - here visualized in a graph.
6. Search Keywords: What are people searching for to find you?
If we only look at those who came to your website via a Google search, it's interesting to know what keywords they used to find you.
Did most people type your company name into the search engine? Or did they search for a product or service you offer? What are people actually searching for that brings them to your website?
Looking at keywords can give you a good insight into what people are interested in, what they are looking for and which keywords bring you traffic.
And not least: You can see which keywords you came up as a suggestion, but where people chose to click to a competitor instead.
NB! In order to see the search terms, you must connect Google Search Console to your website. If you don't have this in place on your Squarespace site yet, you can contact us at Gasta for help.
7. Site Content: What content on the website do people visit the most?
Under "Site Content" you can see how users interact with your website. Among other things, you can see which pages are visited the most, how long visitors spend on the site and the bounce rate for the various pages.
This overview is useful to see what topics and subpages visitors are interested in, and to be able to assess what content works well today and what works less well.
Pages with a high bounce rate or where visitors are only on the page for a very short time should perhaps be considered for a little more work. Are they finding what they're looking for? Is the content presented in a good way? How is the user experience on the site?
In the same way, you can look at the pages that are not visited much and try to find out why. Is there anything you can do to get more visitors here? Is the site visible enough and is the content good enough?
Phew, that was a long list. We're impressed that you stuck with it all the way to the end.
We know it can be a bit overwhelming to look at and analyze all the website data yourself. We at Gasta help many of our customers with analysis and optimization, so don't hesitate to contact us if you have a Squarespace site and need some help interpreting the numbers.